Transforming L&D: Mastering analytics for real-world impact
“Learning analytics is the measurement, collection, analysis, and reporting of data about learners and their contexts, for the purposes of understanding and optimizing learning and the environments in which it occurs.”
Simply put, learning analytics provide an organization with a holistic picture of what’s working and what’s not – identifying potential lag areas within their programs and helping them improve the learning experience they offer. It helps identify the blockers in workplace learning strategies and gives insights needed to reach KPIs.
Every interaction, click, score, and time logged in represents a valuable piece of data. It provides an in-depth look into how employees interact with training materials, granting a deeper understanding of both their learning behavior and engagement levels.
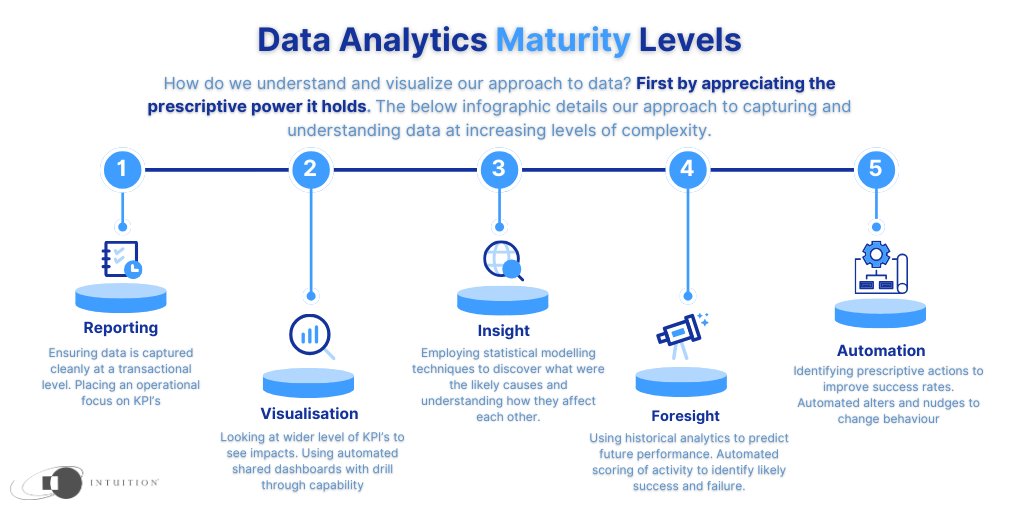
Training and data have always been intrinsically linked. Traditionally, the emphasis has been on tracking outcomes such as course enrolments, pass percentages, assessment scores, and completion rates. While these metrics are vital to demonstrating the effectiveness of training, huge advancements in the area have driven ability to evolve KPIs into more meaningful measurements of a range of factors, including:
- Time to proficiency
- Knowledge retention
- Impact on organizational performance
- Demonstrating ROI
[How to leverage data within your corporate compliance program]
Where does this new learning data come from and what does it look like?
Thankfully, collecting data is the easy part. Leveraging already existing systems such as your LMS or LRS, and integrating xAPIs opens up a huge cache of new data points, rich in diagnostic value and predictive insight. This is especially effective as it doesn’t impact the end user’s experience.
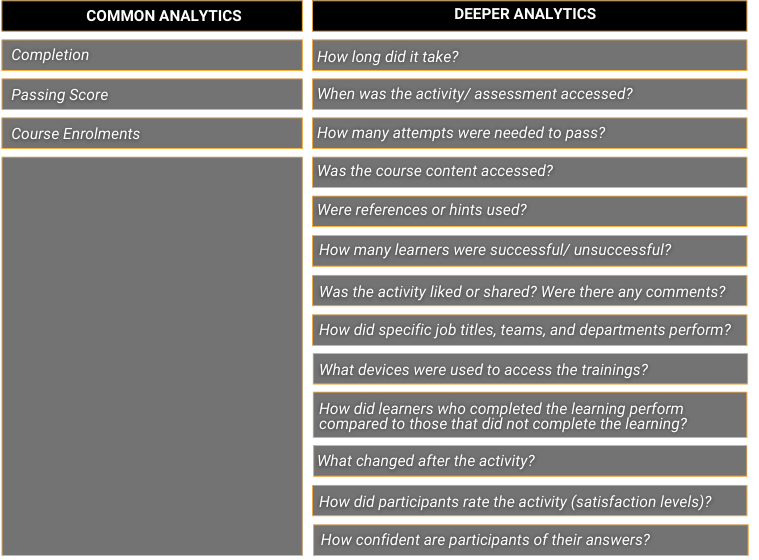
The table below visualizes the contrast between the common and deeper analytics used:

In considering the above analytics, it becomes clear how beneficial these additional reporting features can be. For example, confidence level indicators are very useful. Not only can you discount the ’chancers’ who guessed their way through the MCQ, but you can highlight the groups of those who are “Very confident” yet answered incorrectly. Distinguishing competence from confidence can be hugely important, especially among a fringe user group like this.

How do you convert analytical insights into learning program improvements?
In order to ensure we can make any meaningful sense of new data points, it is vital to craft and implement a data strategy that aims to contribute value to your learning program.
This approach should:
- Engage business leaders first so they’re aware of the data and help interpret the results. They often have insight into some of the intangibles that can affect behavior change outside the control of training solutions (such as an unforeseen increase in workload).
- Establish benchmarks and stick to them. Use them to draw conclusions, using simple “if, then” statements.
- Leverage secondary or tertiary indicators in the data that show potential alternative solutions.
- Use groupings like audience size, location, delivery modality, job levels, and previous performance to guide actionable next steps.
- Make sure to share those findings and the resulting action plans with business leaders.
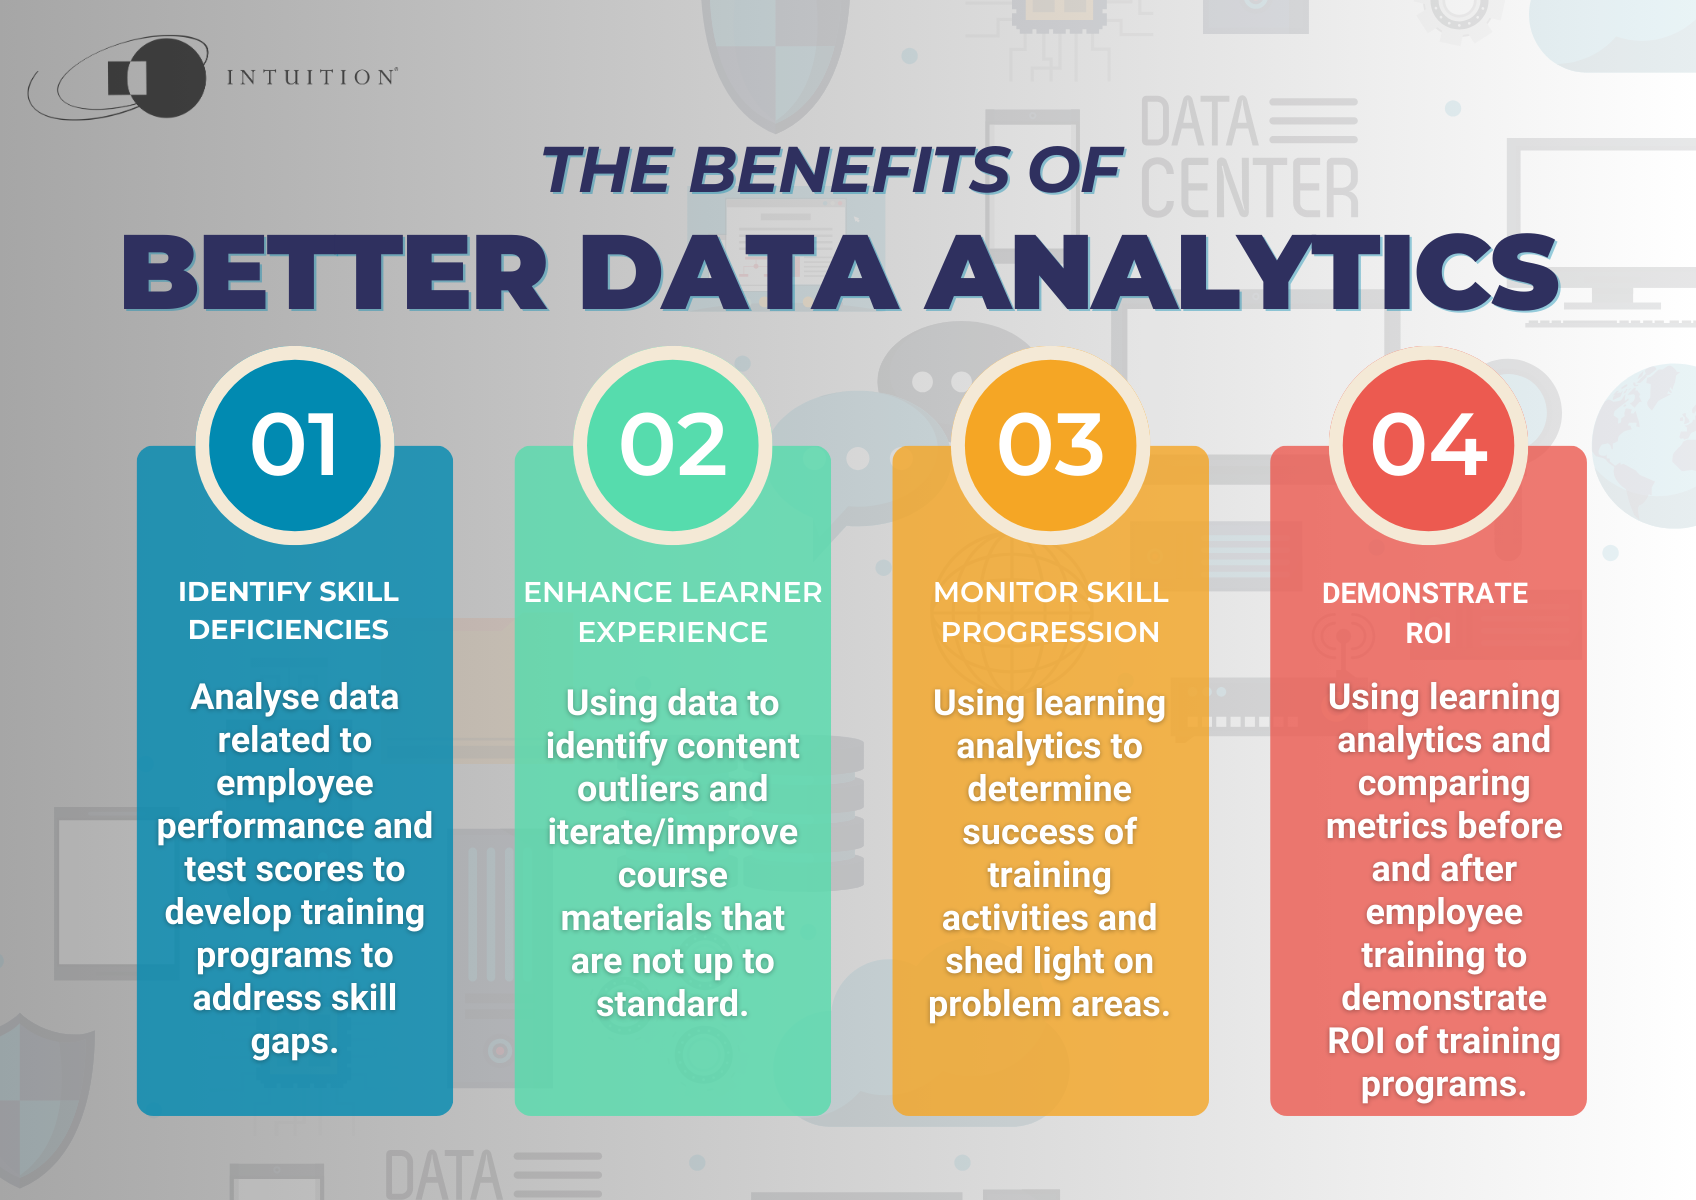
What can we expect from better data analytics?

Identify skill deficiencies
Organizations utilize learning analytics to assess the current skill levels of their employees. This involves analyzing data related to performance, completion rates, and test scores to pinpoint areas where employees may be lacking specific skills or knowledge.
For example, an organization uses learning analytics to analyze employee performance data and discovers that a significant number of employees struggle with data analysis skills. This insight prompts the organization to develop data analytics training programs to address this skill gap.
Enhance the learner experience
Businesses can create content and activities that are more suited to the needs of their learners by studying how they interact with their training materials. For instance, a business may discover that the completion rates of a particular module are low, or that overall engagement time on that module is significantly lower than other courses within their curriculum. Identifying content outliers helps teams iterate and improve on course materials that aren’t up to standard.
Monitor skill progression
With the use of learning analytics, businesses can monitor how well employees are picking up new skills over time. This monitoring aids in determining the success of training activities and sheds light on any potential problem areas.
Demonstrate ROI
By collecting information on training expenditures, monitoring employee performance before and after training – and comparing these metrics to one another – organizations use learning analytics to determine and demonstrate the ROI of their training programs.
Conclusion
Data analysis provides valuable insights into learner behaviors, preferences, and performance, which can be used to create a more personalized and effective learning experience. By regularly monitoring and analyzing these metrics, you can continue to adapt your learning programs, ensuring they remain relevant, engaging, and effective.

References:
- Psychological foundations of emerging technologies for teaching and learning in higher education
- Data-Driven Analytics: Leveraging LMS Insights To Enhance Training Outcomes
- How to Leverage Data and Analytics to Enhance the Impact of Training Programs
- Leveraging Data Analytics to Elevate and Measure Learning Effectiveness
- How to leverage learning analytics

