How to use BI tools to show learning ROI
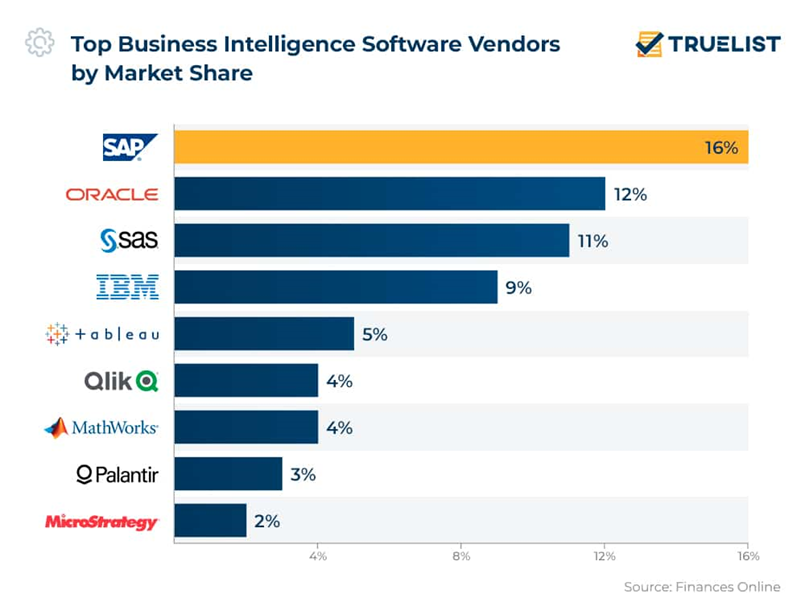
The likelihood is you have come across Tableau, Power BI, Oracle tech analytics and Domo in some capacity over the last few years. Perhaps your company/team already uses one of these, or they are currently considering adopting one of these options.
Companies considering adopting these tools – and indeed those who already deploy them – might reasonably wonder if there is any measurable difference between them. Furthermore, it is sensible to consider if there is any meaningful ROI from off-the-shelf data integration.
Typically, these considerations do not result in a definitive answer. It is useful to sift through the context and discuss the digital training benefits that can be expected from incorporating this kind of tech.
What are BI tools?
Firstly, what are BI tools? How do they work, and where exactly do they sit among your seemingly never-ending technology stack?
The internet provides little in terms of a single-use definition for classifying BI, but generally speaking:
“a BI solution is a combination of strategy and technology for gathering, analyzing, and interpreting data from internal and external sources, with the end result of providing information and analytics about the past, present, and future state of the subject being examined” ~ Oracle
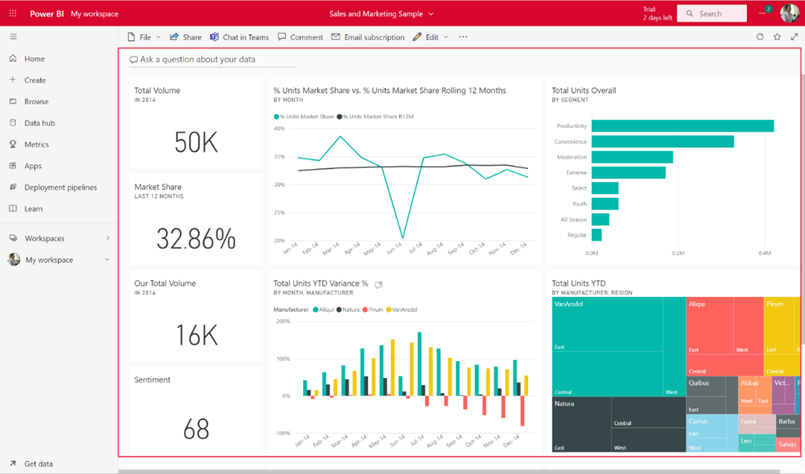
A good BI tool should capture data – wherever it comes from – and in turn offer a means of visualizing that information (customizable dashboards), illustrating the key points, correlations, and discrepancies within the given data. Programs such as the one below are highly customizable, feature-rich, and offer significant scope for users looking to better understand the implications of their data.

Solutions such as the above are only as useful as the understanding of the user. Once the user has a reasonable idea of how to infer insight from their BI Solution, they can start to consider some of the following benefits:
1. Improves data accuracy.
2. Helps in making quicker, more informed business decisions.
3. Allows the sharing of data across the functional areas of a business.
4. Helps to identify and reduce inefficiencies.
5. Boosts return on investment while cutting total cost of ownership.
6. Enhances transparency and service at all levels.
While the applied benefits are obvious from a general point of view, it is helpful to think of industry-specific examples. Organizations across practically every kind of industry rely on BI solutions to help visualize what is difficult to read from their source data.
Below are a few case studies that will provide a sense of how these tools are applied in the context of industry.
Financial markets:
Customized reporting is essentially the be-all and end-all when managing investment portfolios. Without these tools, portfolio managers would be left in the dark, forced to collate data points from disparate systems, all the while increasing the risk they run for making a poor judgement call.
Supply chain management:
Logistics managers use BI tools on a case-by-case basis, often relying on data points to represent delivery time progress, inventory level management, and overall customer satisfaction. It has become a massive crutch within the logistics industry over the past 15 years.
Pharmaceutical manufacturing:
Pharmaceutical R&D departments use BI tools to gauge clinical trial success and failure over decades – pulling in data points from past trials to determine pathways that offer the highest opportunities for probable success. These solutions are of massive importance when it comes to visualizing the success of experimental drug alternatives, essentially guiding innovation at every step.

Now that we have set the context and given some insight, let us apply some of our industry expertise and look at how BI tools can help illustrate training data.
Using BI tools to measure and score your training data
Training data is just another variable plugged into BI tools, used by L&D teams to measure and score the most important aspects of their training program performance. Systems such as this are particularly useful when it comes to keeping in step with a training program’s key performance indicators.
While small corporate outfits with fewer than 100 users might not see the sense in investing in a bespoke or off-the-shelf BI, program managers at medium- to large-scale companies have every reason to consider how to best utilize their training data. Learning initiatives delivered on a global scale to independent regions, in different languages, and to dozens of departments, require meticulous attention to detail. This is especially true when it comes to averaging out learner performance across regions and departments. While there are always lagging areas, it is important to minimize variability by recognizing outliers as they occur.
Having a comprehensive analytics offering that helps in understanding the minutia of training data is essential in terms of getting reporting up to speed, as well as maximizing the value of insights gleaned from what those reports have to say. Below we have listed several key reporting and insight features we at Intuition rely on to help organizations illustrate and understand what their training data is trying to tell them.
Reporting features:
Data segmentation:
Enables administrators to segment and filter data based on various criteria such as courses, departments, time periods, and learner demographics. This allows for both pre-defined report templates for common use cases, but also allows users to create highly customized reports that focus on specific areas of interest.
Compliance reports:
Create audit trails to maintain detailed records of user activity and interactions within the LMS to support compliance and regulatory reporting requirements. With this, Certification Tracking can provide reports on the status of certifications and compliance training to ensure all necessary qualifications are met.
User performance reports:
Provide detailed reports on individual learner performance, including assessment scores, progress, and completion rates. Offering insight into the performance of specific groups or cohorts, allowing for targeted interventions and course improvements.

Insights Features:
Learning path optimization:
Apply insights to create adaptive learning paths in real-time based on a learner’s progress and performance. Use data to refine course content and make learning materials more effective and engaging.
Return on investment assessment:
Evaluate the ROI for different training programs by comparing the costs of development and delivery with the benefits of improved skills and performance.
Ensure regulatory compliance:
Use insights to ensure that the LMS is meeting regulatory and accreditation requirements, making data-driven adjustments when needed. Maintain records of user activities and system changes to support compliance and auditing.
Continuous improvement:
Regularly analyze insights to identify areas for improvement in course content and assessments. Implement feedback loops where insights from the learning inform ongoing course updates.


